Product walkthrough

How it works.

Twenty-two parts of the terminal, on one market-data layer. The screenshots are the running application, and the switch shows each one in either of the terminal's two layouts.

Pro is the denser one-screen layout, on the Pro plan and for beta members, on a laptop, a desktop or a large tablet. It carries the same data and the same controls as Standard, and is turned on in Settings.

01 · Dashboard

The chart, the numbers behind it, and the news around it.

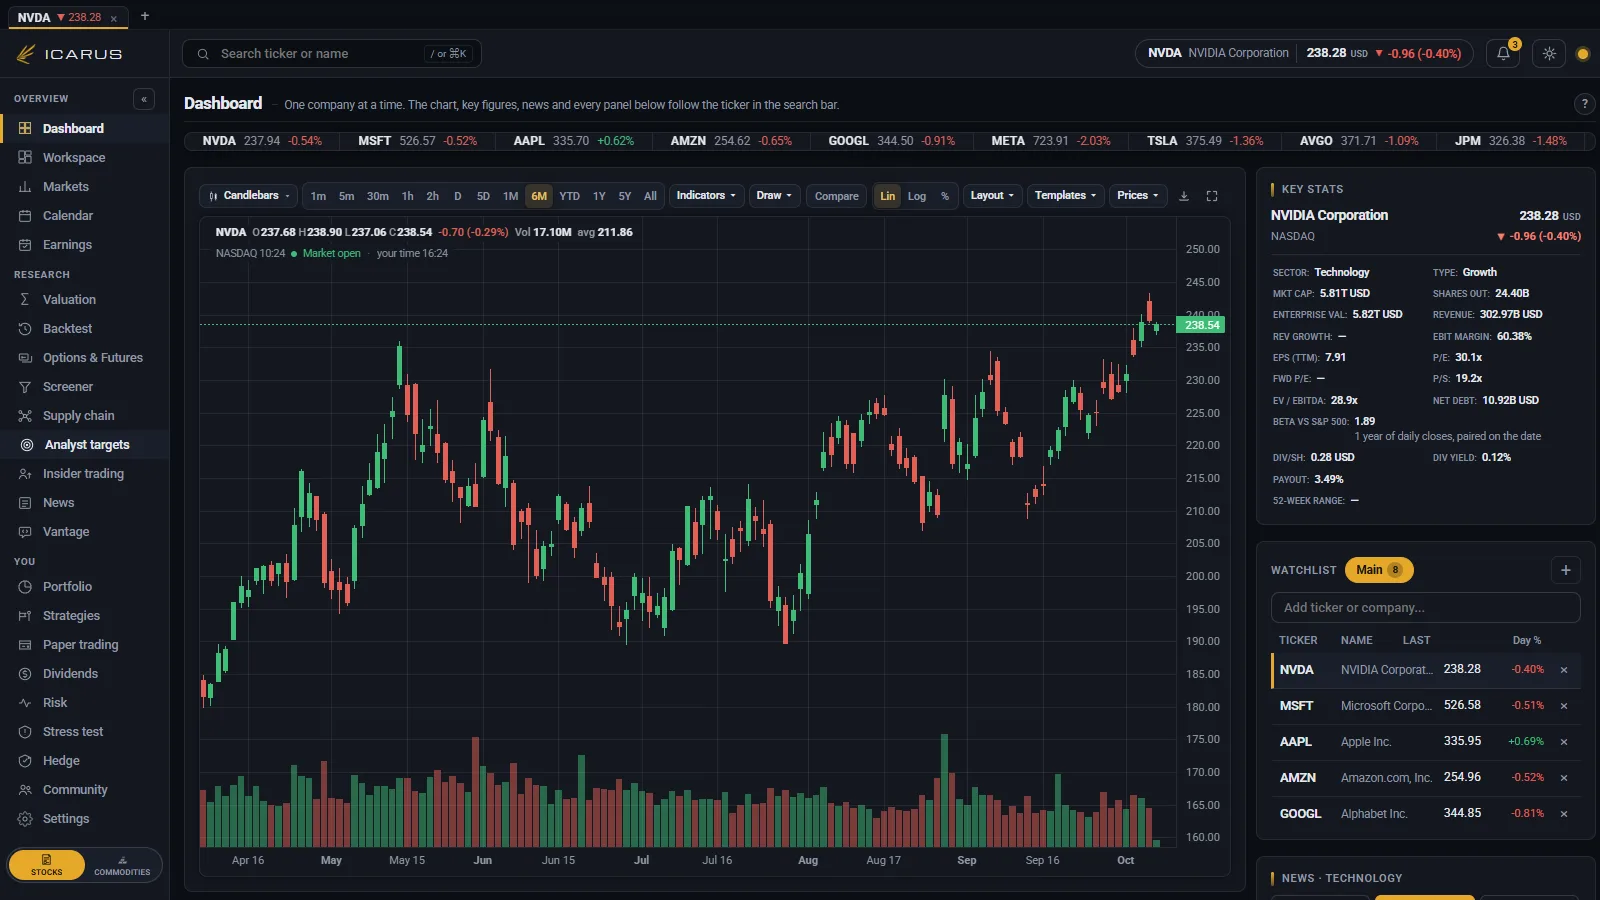
The dashboard opens on a price chart with the toolbar above it: candlesticks, bars, line or area, timeframes from five minutes to the full history, an indicator picker and a set of drawing tools. Anything you draw is kept against that symbol and is there when you come back to it.

Beside the chart, the key statistics panel holds the figures you would otherwise look up elsewhere: market value, revenue and how fast it is growing, profit margin, earnings per share, the common price ratios, net debt and the 52-week range. Below it sit the watchlist and the headlines filed against the symbol you are looking at.

  • Indicators overlay the price pane or take a pane of their own
  • Drawings, indicator settings and timeframe persist per symbol
  • Prices are delayed market data, never generated or filled in
The Suros dashboard: candlestick chart with volume, key statistics, watchlist and a per-symbol news feed
02 · Search

One field for every listed instrument.

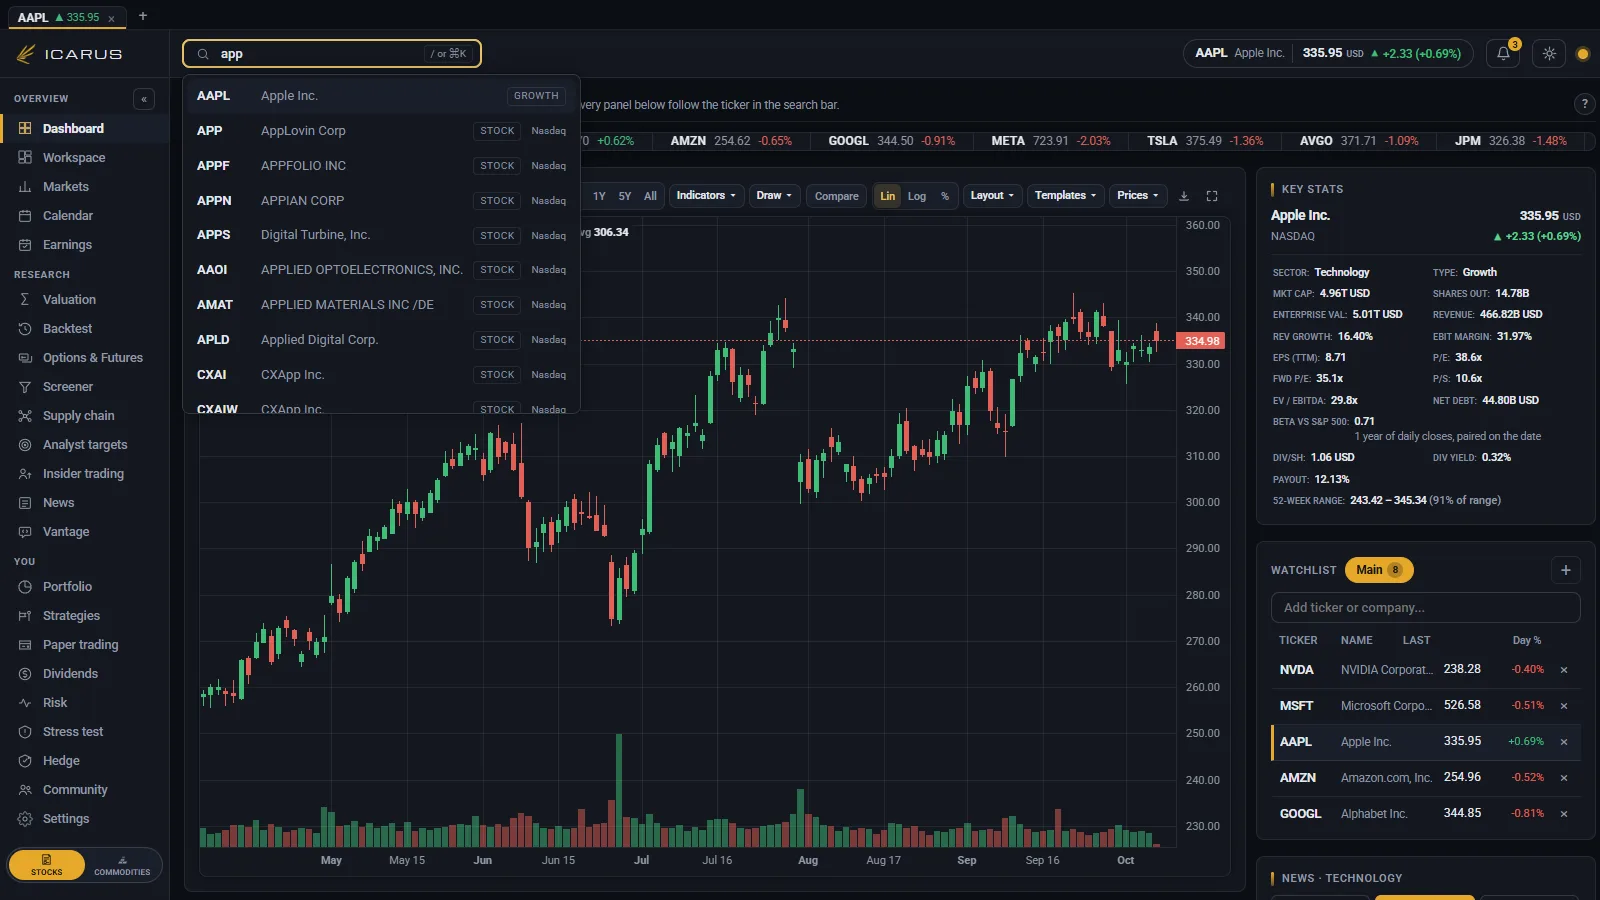
Search takes a ticker or a company name and returns matches from every market the data covers, each row labelled with what the instrument is and where it trades. A partial query is enough: three letters returns the US listing, the Toronto ETFs, the São Paulo depositary receipt and the tokenised version, so you can tell them apart before you commit.

The field is reachable from anywhere with the slash key or Command-K, and the arrow keys move through the results. Choosing one loads that symbol into every panel at once, so the chart, the valuation model, the options chain and the research tabs are all looking at the same company.

  • Stocks, ETFs, depositary receipts, futures and crypto in one list
  • Exchange and instrument type shown on every result
  • Recently opened symbols stay at the top of the list
The search field open with results for a partial ticker, each row showing the instrument type and exchange
03 · Valuation

Two ways in: a short model to learn on, a full one to work in.

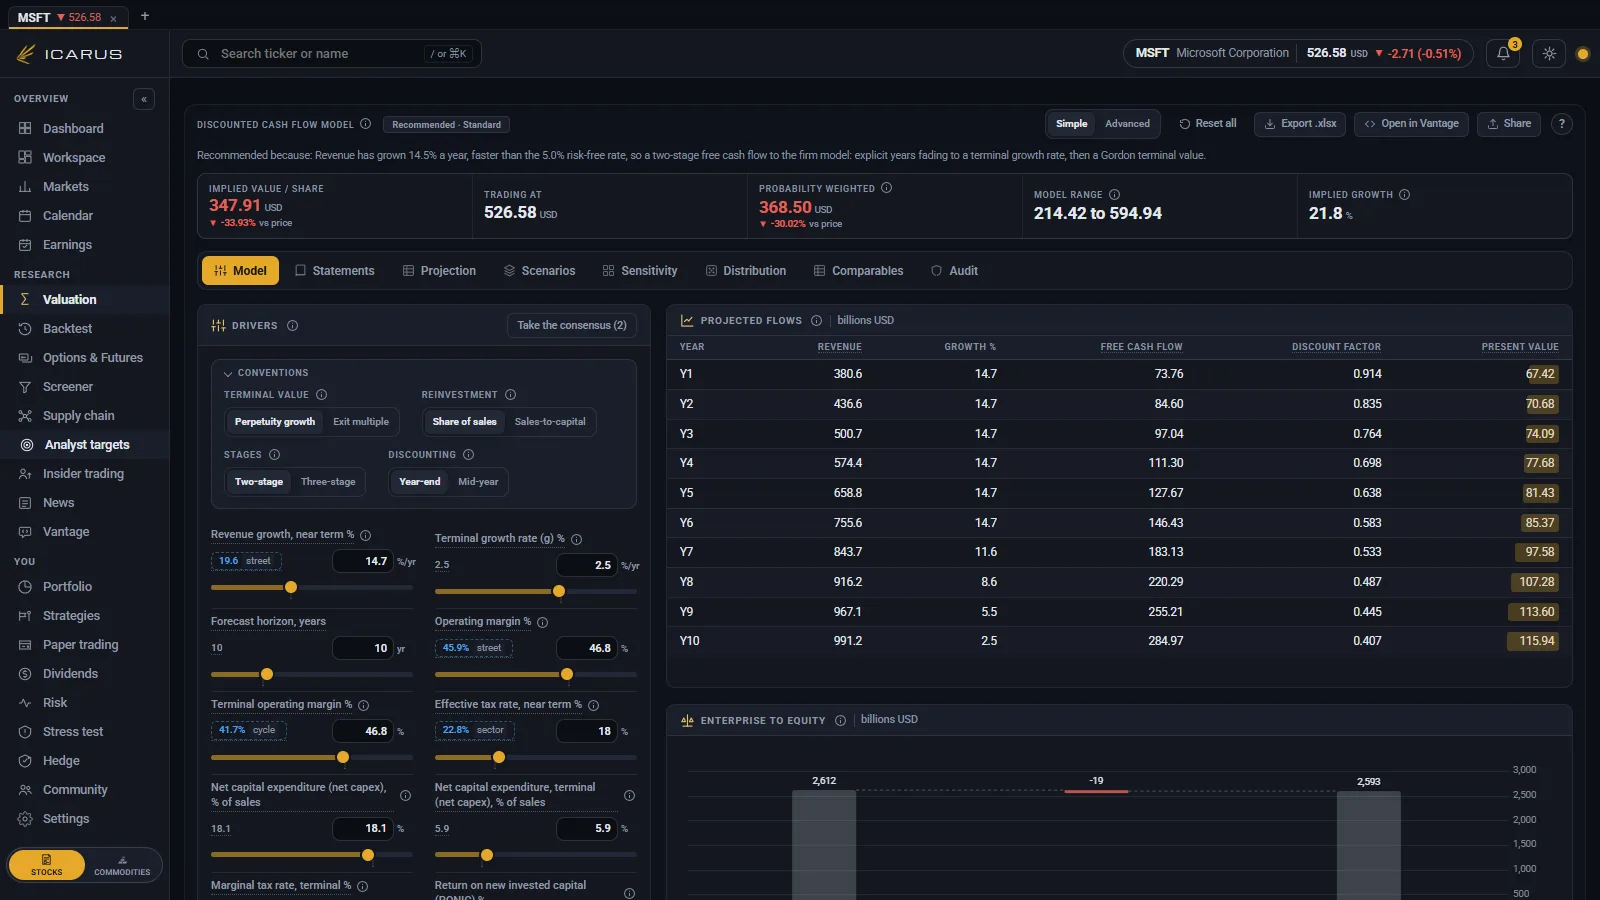
Simple mode reduces a valuation to three assumptions (growth, margin and the discount rate) and shows the arithmetic beside the result, so you can see where the number comes from. It is the place to learn how a valuation works.

Advanced mode picks the model that suits the business: a cash flow model for most companies, a book-value model for banks, a rental-income model for property trusts. Every line can be edited, the full history of the company's accounts sits behind it, and a sensitivity grid shows how far the answer moves when you change the discount rate or the long-run growth.

  • Model chosen to match the business, not one template for everything
  • Assumptions are yours; nothing is pre-filled with a house view
  • Sensitivity grid shows the range, not a single figure
The valuation view with an editable model, assumptions on the left and a sensitivity grid
04 · Screener

Listed stocks, largest first.

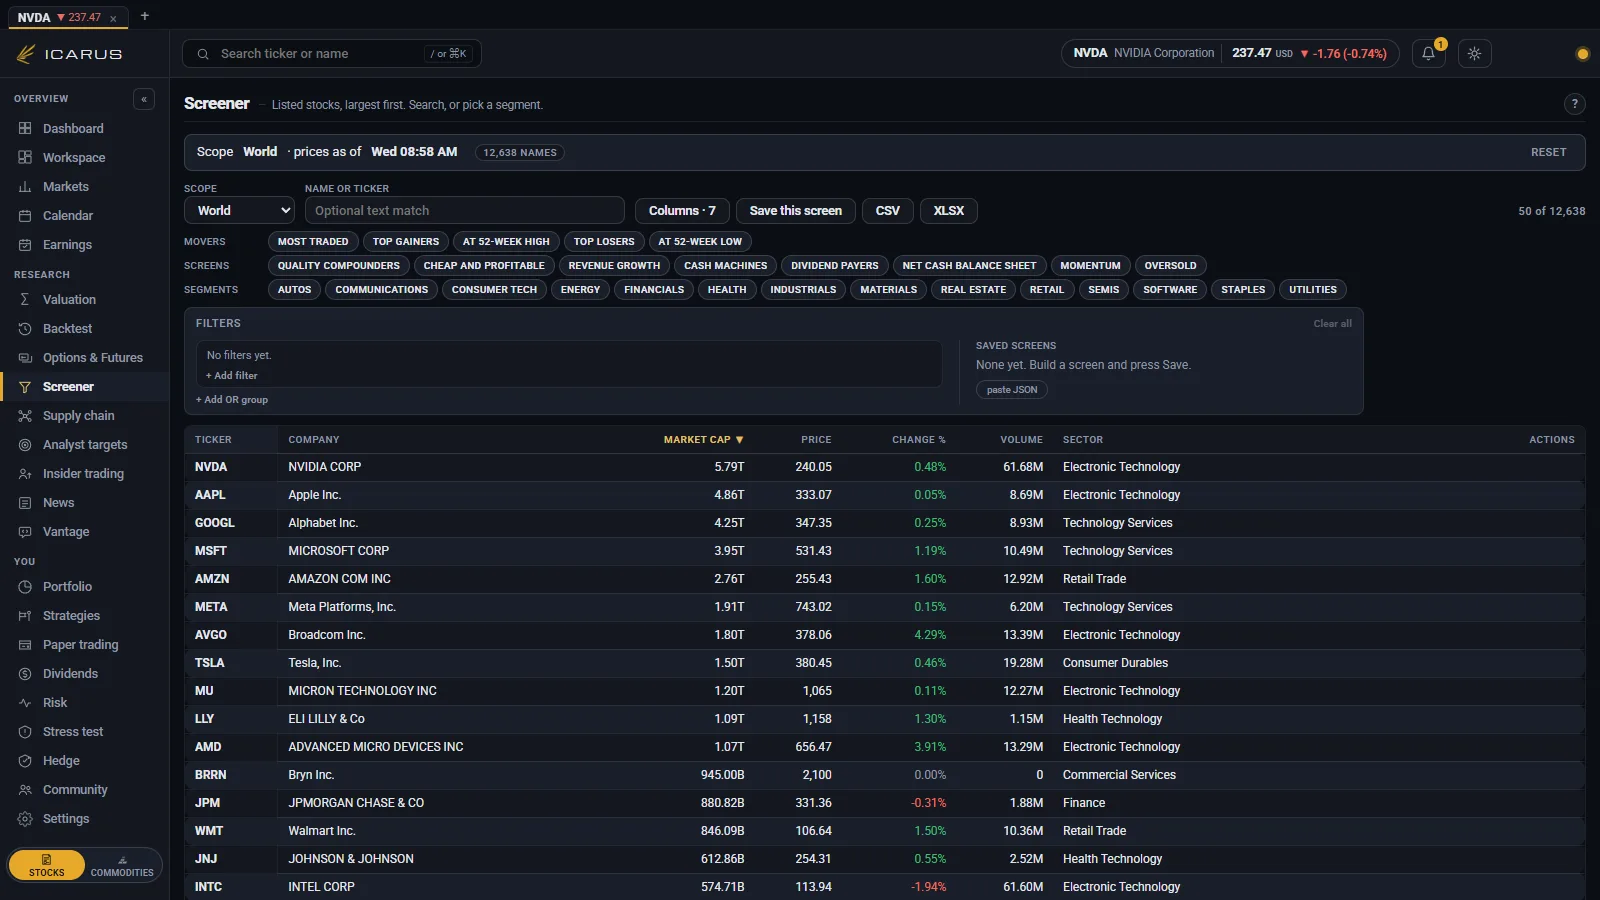
The screener reads the terminal's own scan of more than twenty thousand listings, every company in its security master, rather than a fixed index. It opens on the largest companies in the world by market capitalisation, converted to a single currency so the ordering means something, and pages further down on demand.

The segment control narrows it to one part of the market, such as banks and insurers, semiconductors, retail or property, and the search box finds any listing by ticker or company name. Selecting a row opens that company on the dashboard.

  • Market capitalisation, price and daily change on every row
  • Segment filters resolve to the market’s own classification
  • Reached from the supply-chain map, which opens the screener on a segment
The screener listing the largest companies worldwide with market capitalisation, price and daily change
05 · Backtest

A rule, tested against the history it would have traded.

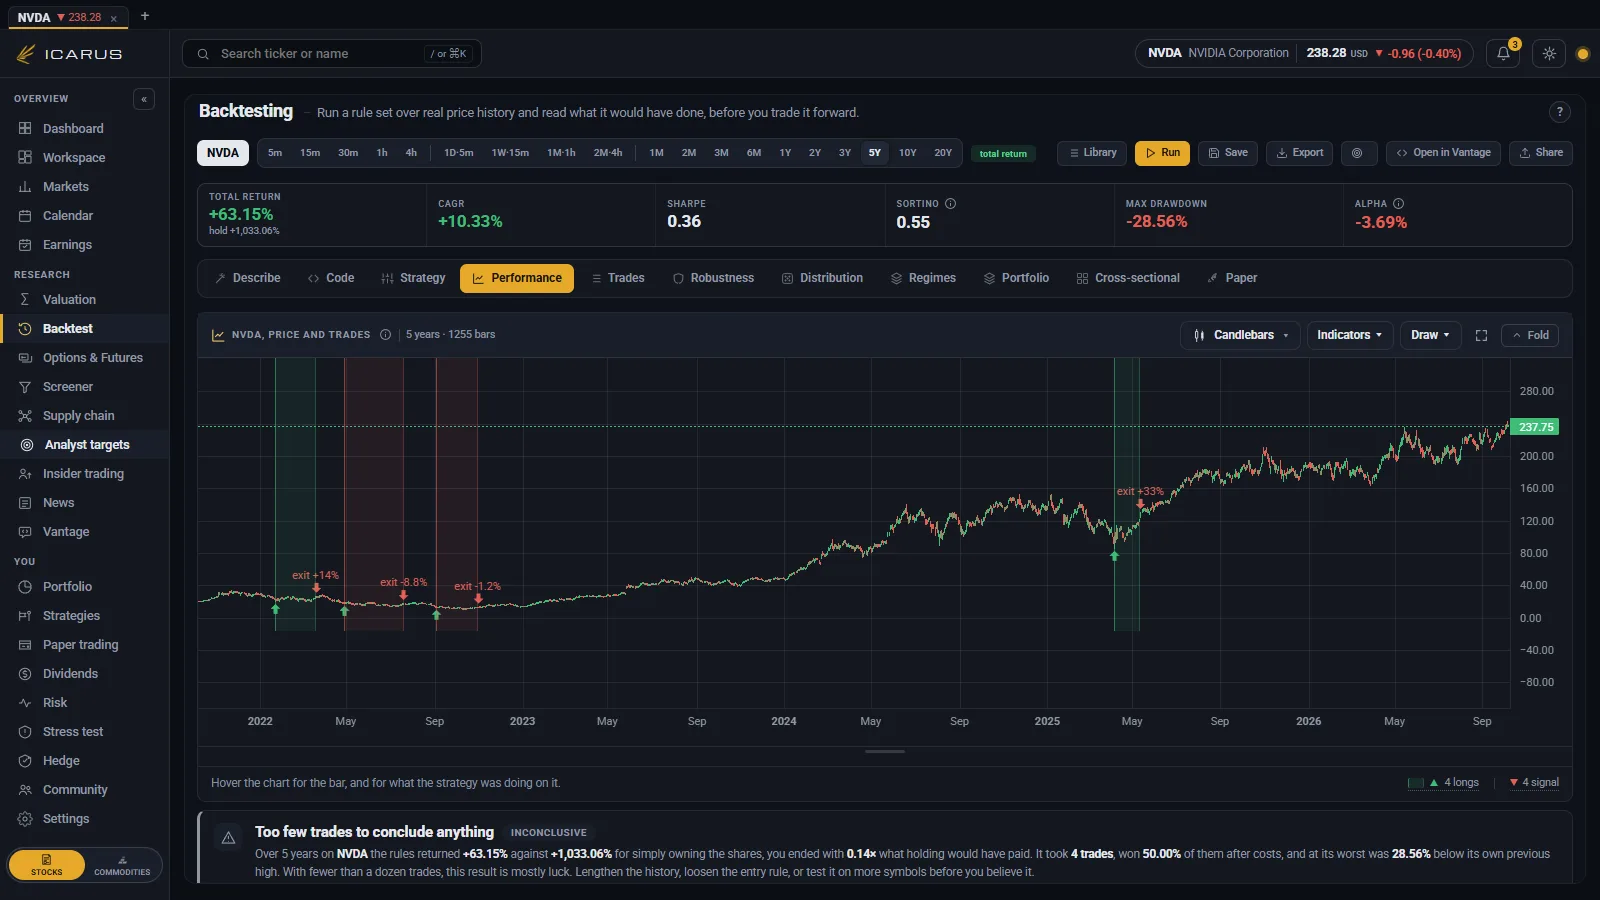
A strategy is a set of rules for when to buy and when to sell, built from indicators such as moving averages or RSI, with position size, stop loss, take profit and trading costs alongside. You can also describe the idea in plain English, or paste one written as code, and read the rules it turns into before running anything.

Results are set against simply buying and holding the same instrument over the same years: total return, yearly growth, the worst fall, the win rate and every trade, all on one Backtesting page. The Robustness tab checks whether the result is real or luck, because one backtest that looks good is the easiest result to produce.

  • Rules are visible and editable however they were written
  • A library of ready-made strategies to run or use as a starting point
  • Robustness checks are separate from the headline result
The advanced backtest builder with entry and exit conditions, risk settings and performance output
06 · Trade analysis

Which trades made the money, and when.

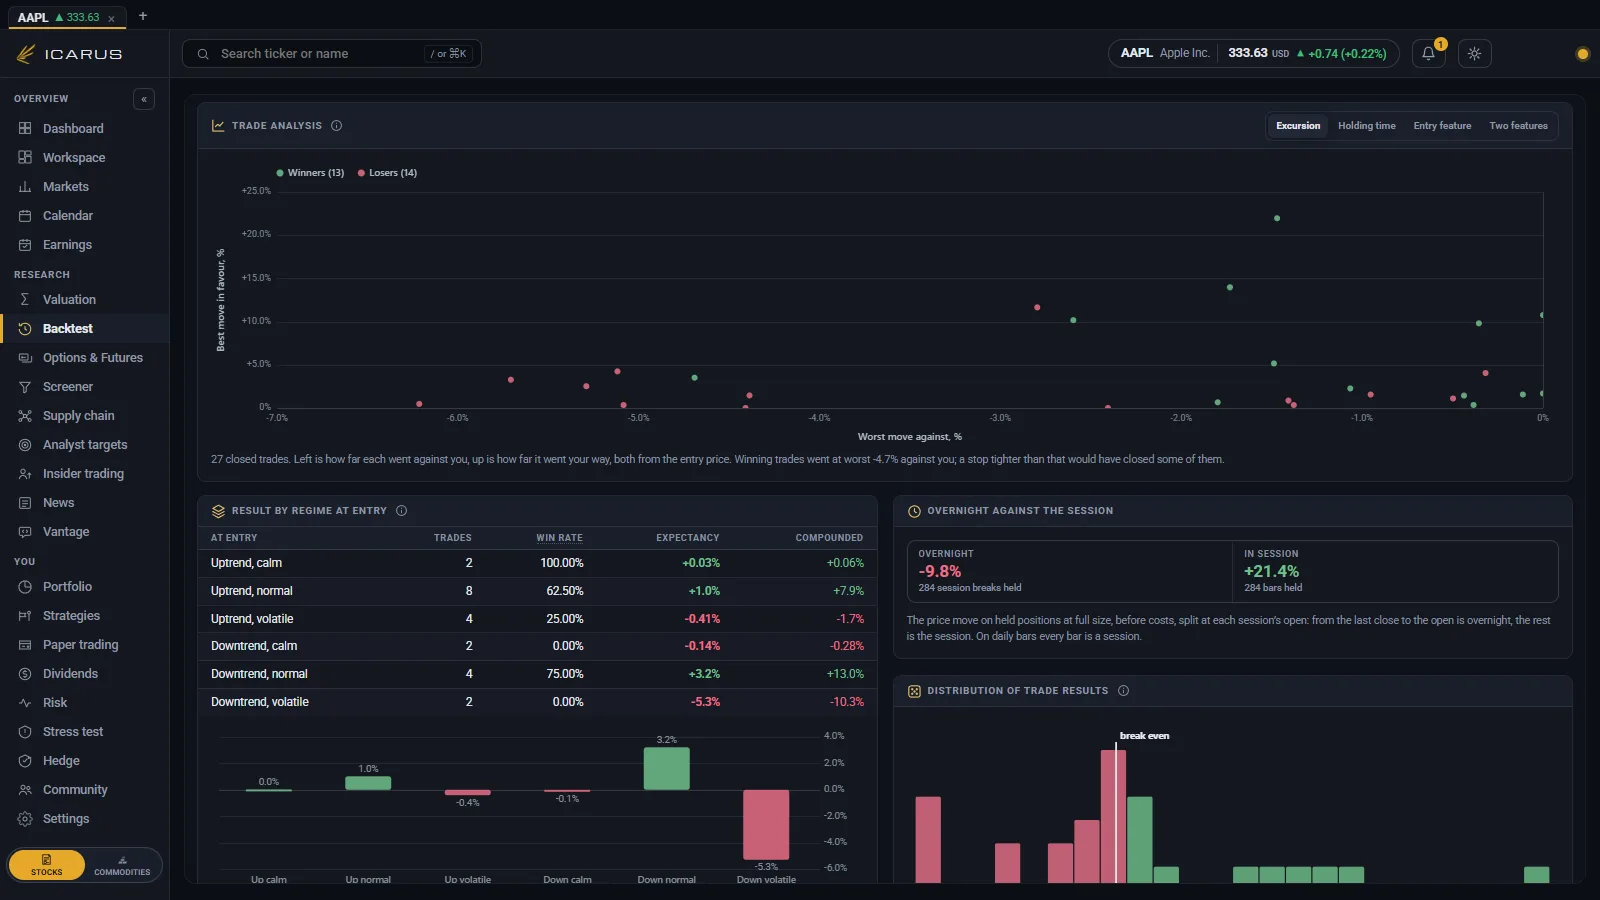
After a backtest, the Trades tab plots every closed trade as a dot. The first view sets how far each trade went against you beside how far it went in your favour, so you can see how much room the winners needed before they paid. Other views set the result against how long the trade was held, or against a reading taken when the rule fired.

Below the chart the results are split by the market at entry, rising or falling and calm, normal or volatile, and the move on held positions is split into what happened overnight and what happened during the session.

  • Built from the run’s own trades and bars, nothing else
  • A reading at entry uses only bars up to the one the rule fired on
  • Two readings at once, in 2D or in 3D with the result as the height
The trade analysis on a backtest: every closed trade plotted by its worst move against and best move in favour, with the result by market regime and the overnight split beneath
07 · Paper trading

A simulated account on market prices.

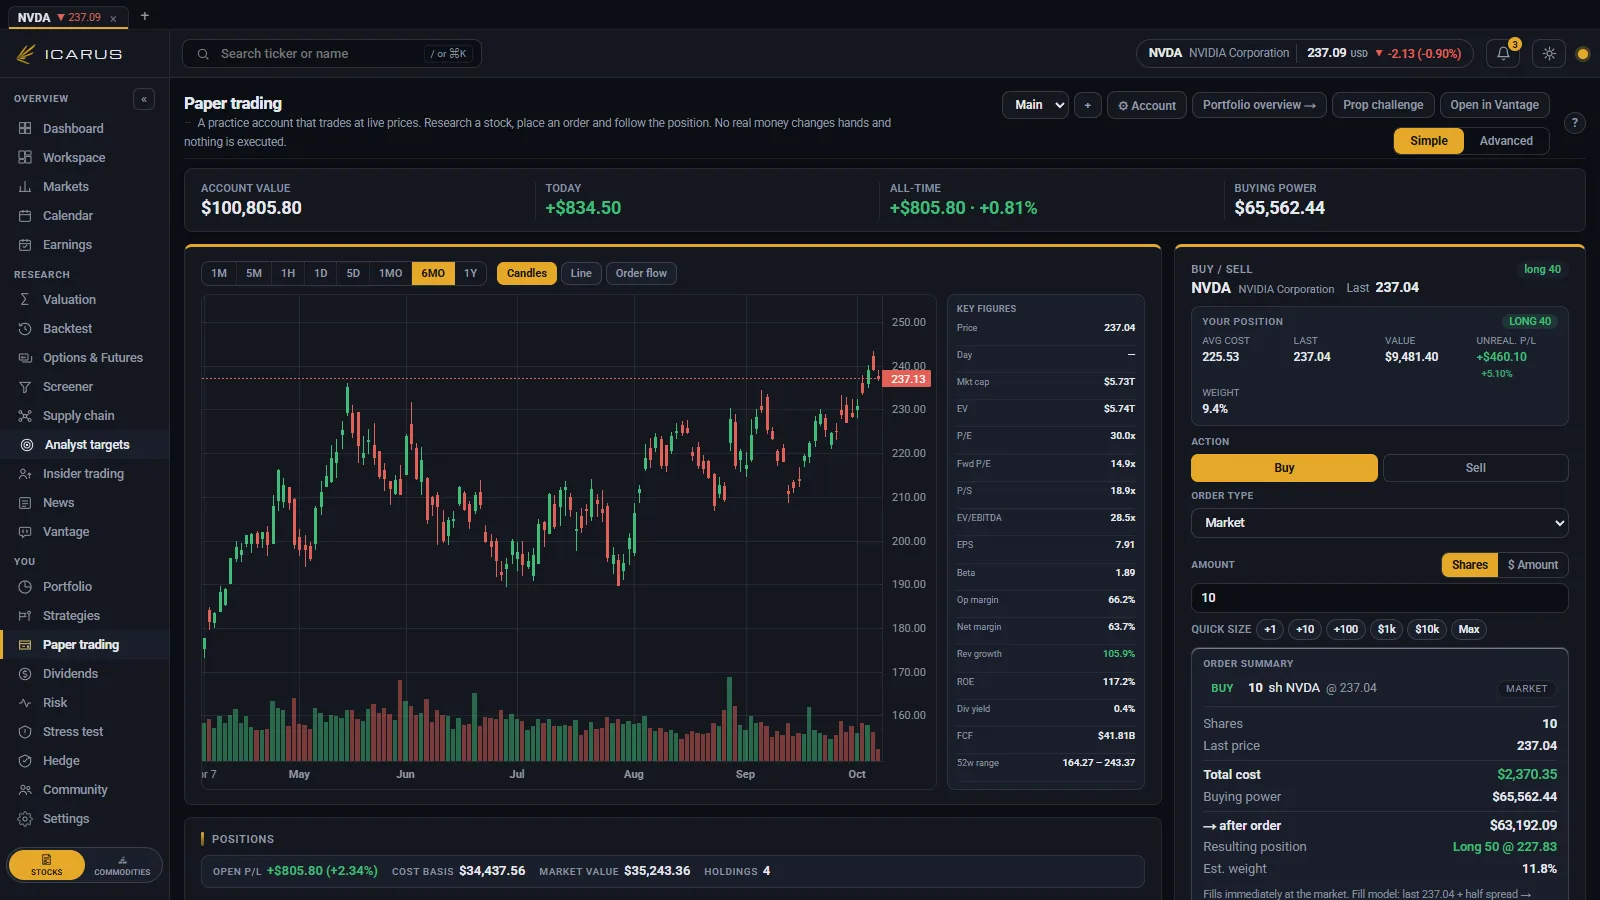
Paper trading runs one or more named accounts with a starting balance you set. Orders are market, limit, stop, stop-limit or trailing, and every one is shown for review, quantity, price, total cost and the buying power left afterwards, before it goes anywhere. Closing or trimming a position is reviewed the same way, with the profit or loss it books stated up front.

Simple mode covers buying and selling shares and crypto. Advanced adds short selling, order duration, options and futures, and the full order book. A strategy built in the backtest can be deployed to an account and left to trade its own signals, with every fill it makes recorded for review.

  • Market prices, delayed as each exchange allows, simulated fills, no broker and no real order
  • Several accounts, each with its own capital and settings
  • Deployed strategies can be stopped at any point
The paper trading desk: chart, key figures, order ticket and the open position book
08 · Prop challenge

Would this strategy pass a trading firm’s test?

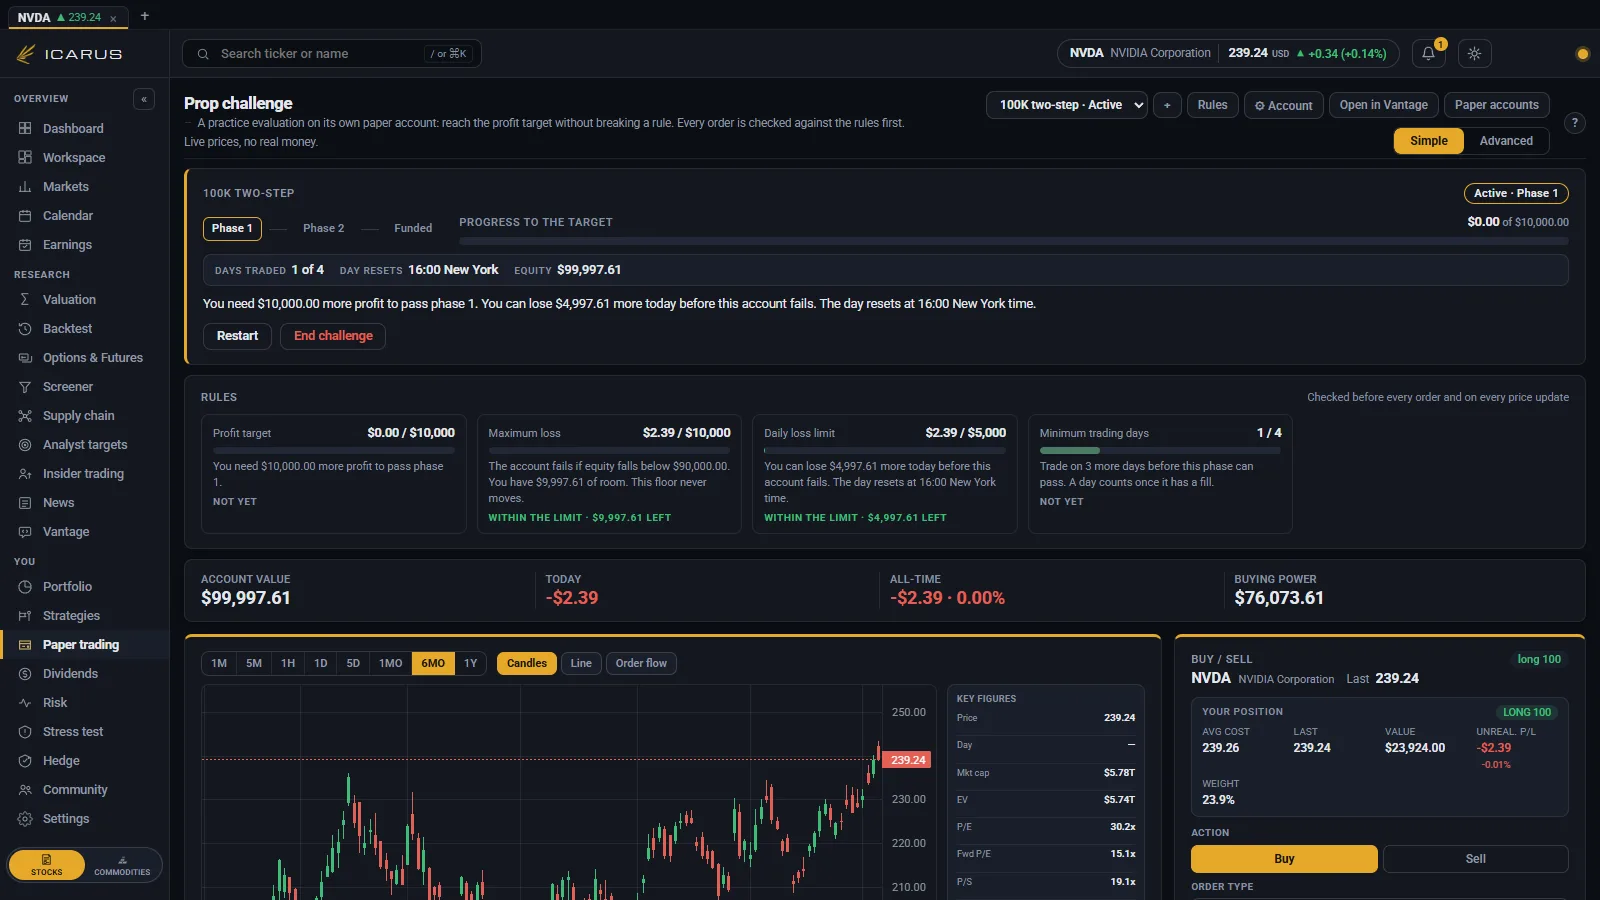
A prop challenge is a paper account with rules: a profit target to reach, a loss it may never go past, a daily loss limit and a least number of trading days. Every order is checked against the rules before it is placed, a meter for each rule shows how much room is left, and each phase ends in a pass or a fail.

A backtest can be sent straight to a challenge. Whole trading days of its trades are replayed in a random order two thousand times, to show how often the strategy would reach the target before it broke a rule.

  • Templates, a firm’s published rules with their date, or every rule set by you
  • A funded stage after a pass, still simulated
  • No real money, and no firm behind the account
A running prop challenge in paper trading: the phase and the progress to its target, a meter for each rule with the room left, and the account holding its first position
09 · Options

The chain, the Greeks and what the position pays.

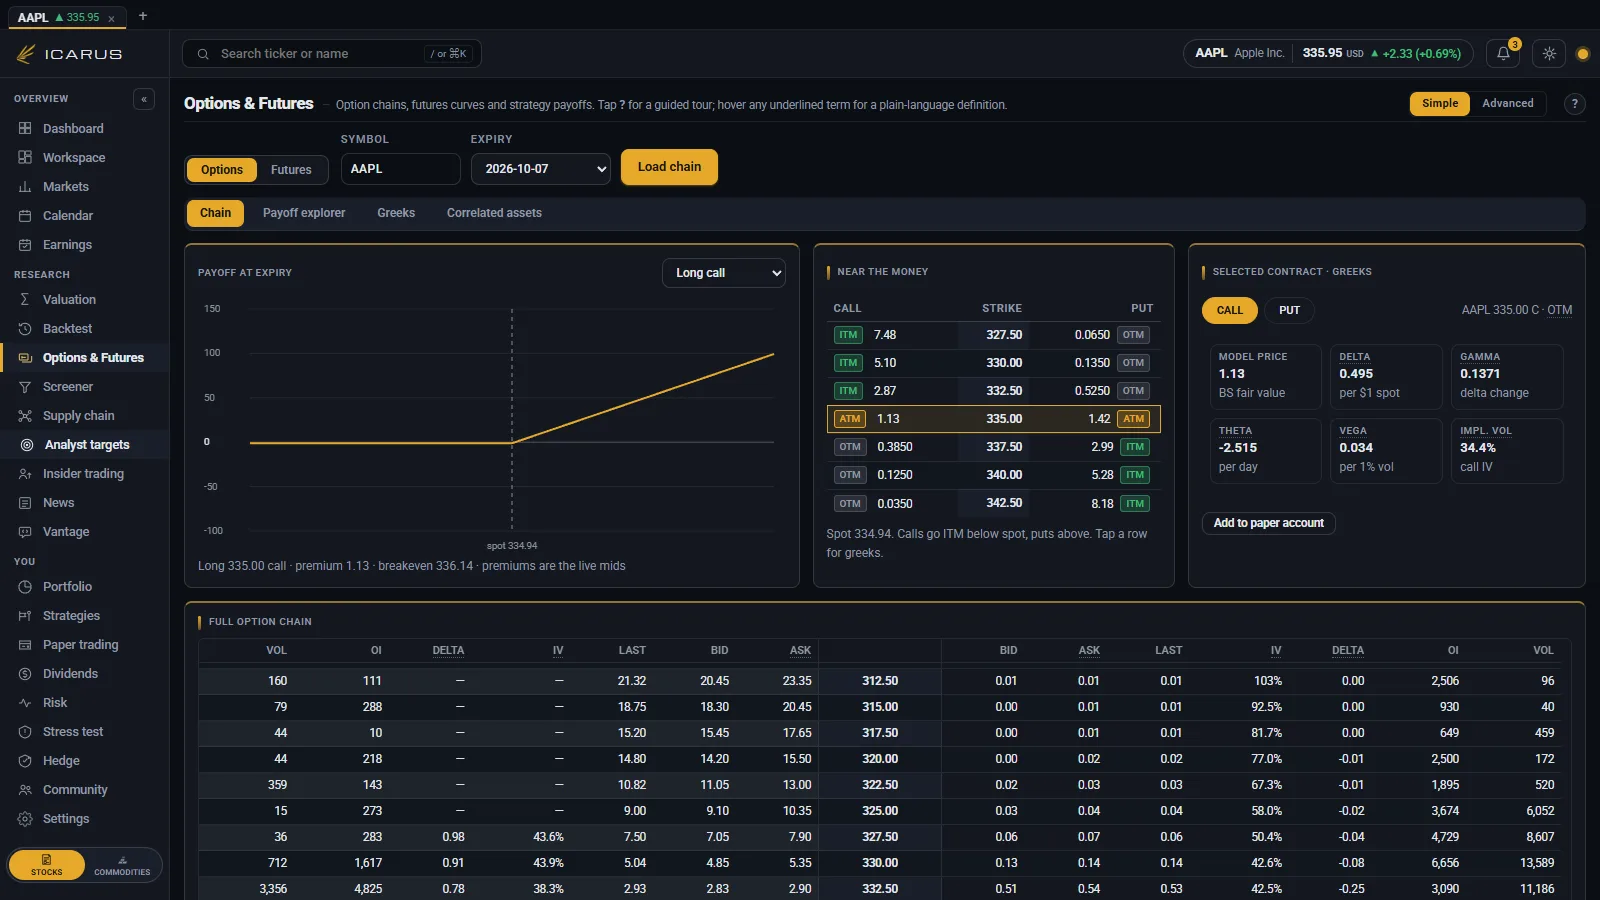
The chain lists every strike and expiry with its bid, ask, volume, open interest, implied volatility and the Greeks, the measures of how an option's price reacts to the market. Filters keep a long chain readable.

Positions with several legs start from a template (covered call, cash-secured put, vertical spread, iron condor, straddle, calendar) or are built one leg at a time. The payoff diagram redraws as the strikes change, showing the break-even points and the maximum gain and loss at expiry.

  • Greeks and implied volatility on every strike, not only at the money
  • Payoff, break-even and maximum loss recalculated per leg change
  • Positions can be carried into a paper account
The options chain with implied volatility and Greeks per strike, and a payoff diagram for the selected legs
10 · Portfolio

What you hold, what it is worth, and what it is exposed to.

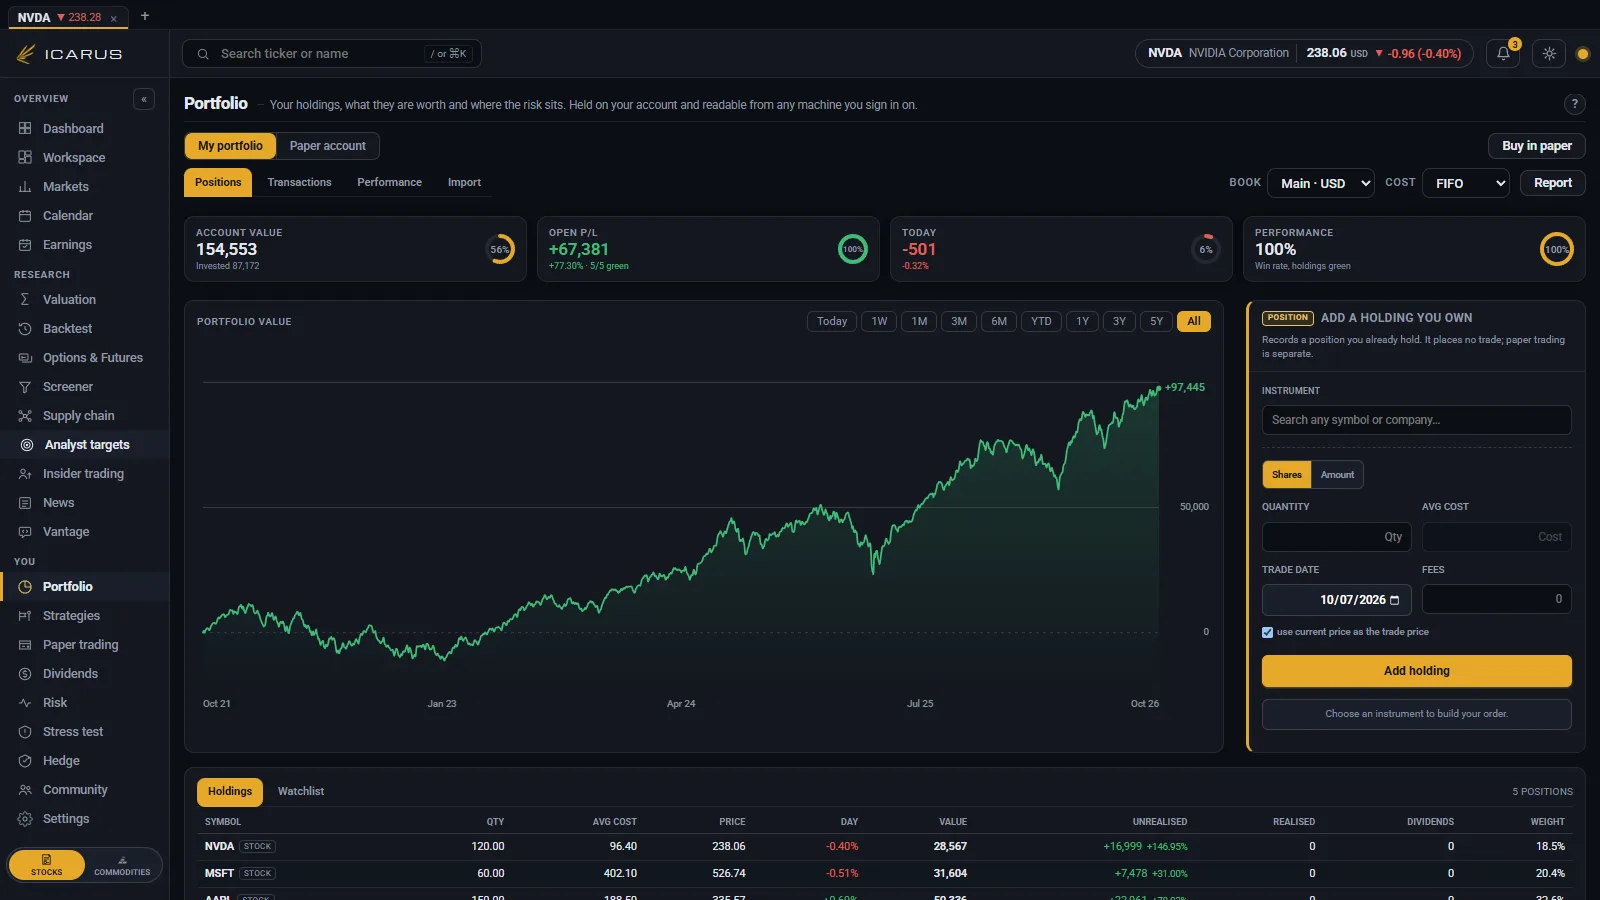
Holdings are entered by hand or imported from a CSV. Each is valued on market prices, with the delay and time on each, in its own currency for the per-share figures and in your base currency for value, profit and weight. The value chart runs the book back over the window you choose, and a concentration note flags any position that has grown past a sensible share of the whole.

Below the book sit portfolio metrics, a correlation and volatility read, projected dividend income, and a side-by-side comparison of any two listed companies on the figures from their own filings. The same view switches to a paper account, clearly marked, so simulated positions are never mistaken for real ones.

Beta, how much a holding tends to move with its market, is measured against the index of the exchange it trades on, so an Oslo share is compared with Oslo and not with a New York close hours later. Every beta names its index and the period it covers, a picker offers twenty-five indices, and where a market has no published index no beta is shown rather than a misleading one.

  • Positions sync to your account, not just this browser
  • Base-currency conversion applied before anything is compared
  • Beta named against the index it was measured on, or withheld
  • Paper and real books are separated and labelled
The portfolio view with five holdings priced from the quote feed, the account figures, the value chart and the form for adding a holding
11 · Stress test

What a bad year would have done to this book.

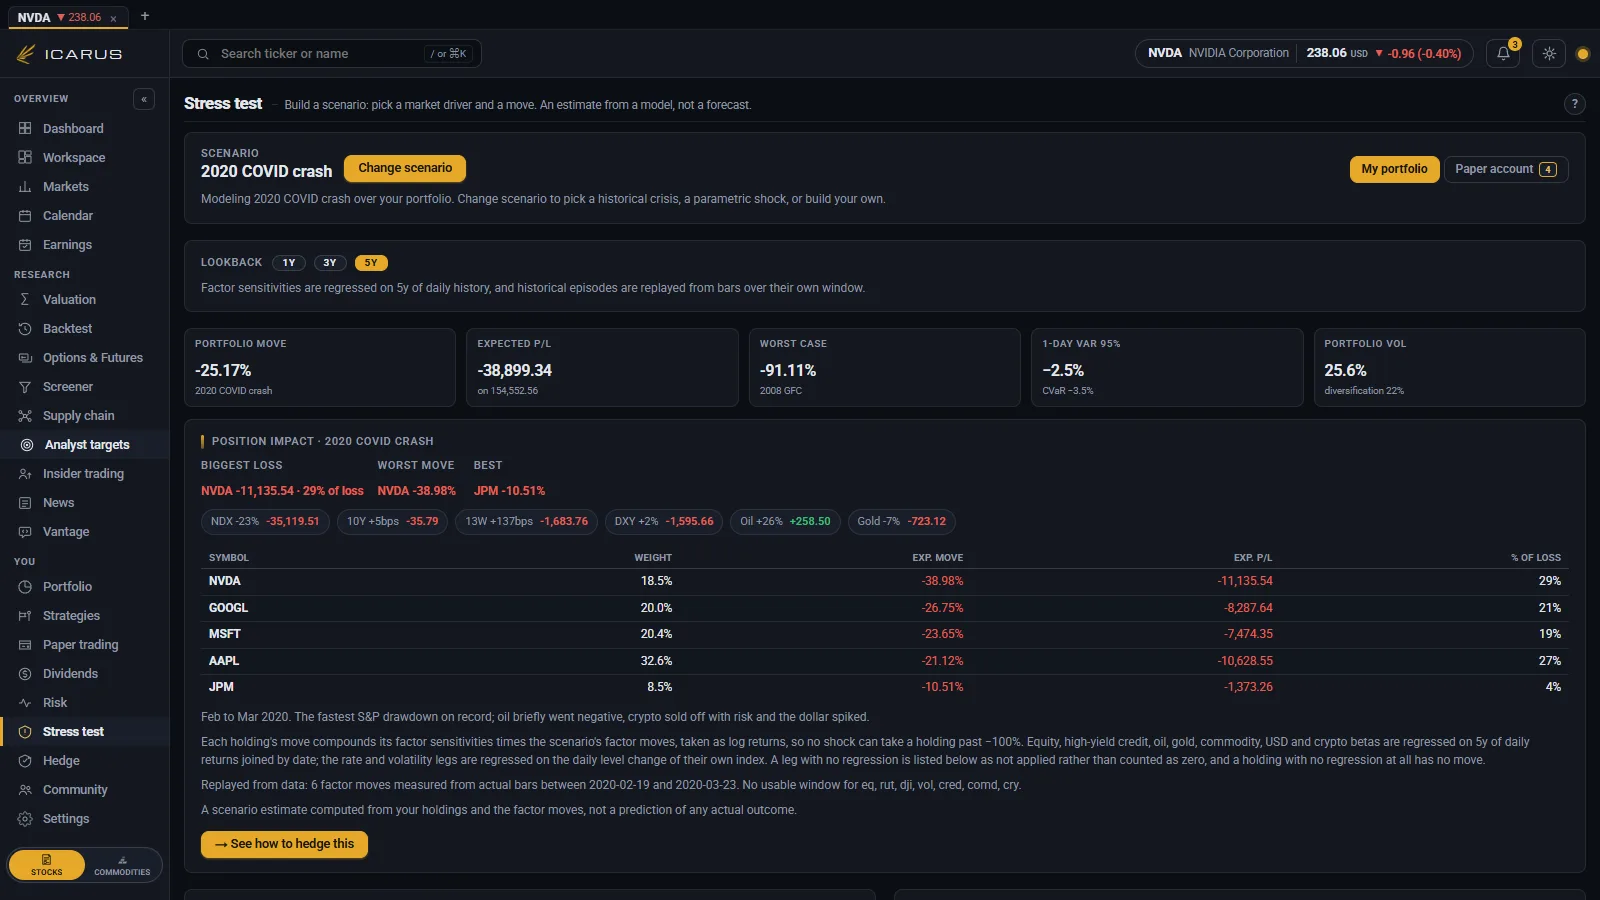
Choose a historical episode (the 2008 credit crisis, March 2020, the 2022 rate rises) or set a shock yourself in shares, currencies and interest rates. Each position takes the shock according to how it actually behaved, not one blanket percentage for the whole book.

The output is the drawdown for the book, the damage per position and a ranking of what would have hurt most. From there you can try a hedge, such as index puts, gold or raising cash, and see how much of the loss each one absorbs. Nothing here places an order.

  • Named historical episodes and custom shocks
  • Per-position damage, not a single portfolio number
  • Hedges are modelled, never executed
The stress test view applying a historical shock to a portfolio and ranking the damage by position
12 · Workspace

Your own arrangement of the same panels.

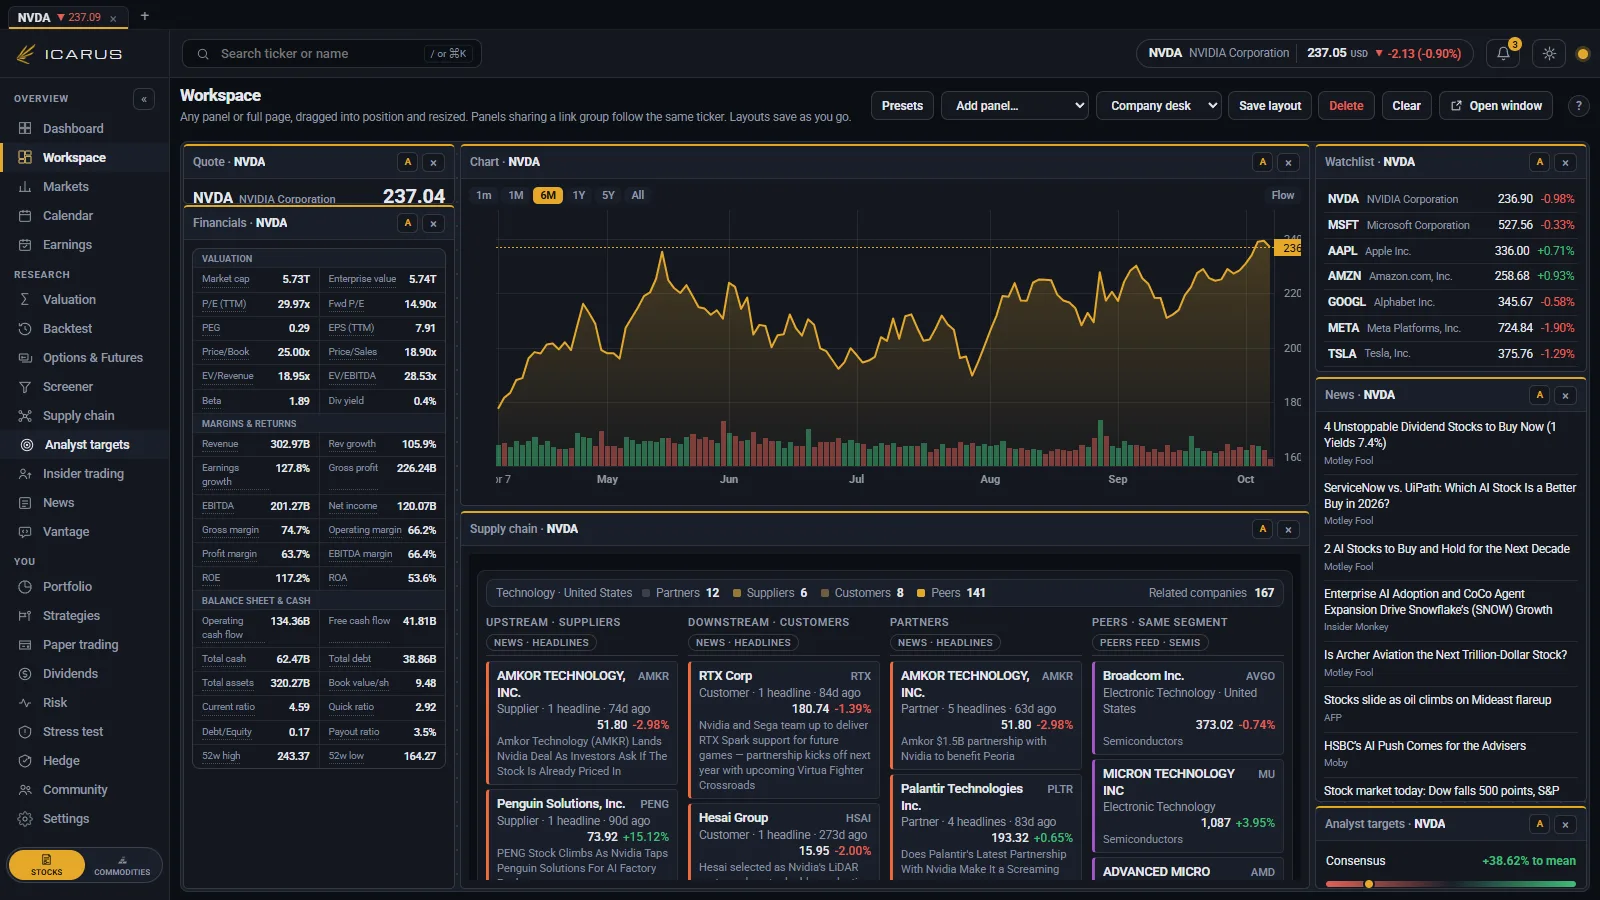
Every part of the terminal can be placed as a panel: chart, financials, watchlist, news, analyst targets, heatmap, correlation, portfolio. Panels are dragged into position and resized, and the layout is saved as you go.

Presets cover the common arrangements (research, trading, options, portfolio review) and can be adjusted and saved under your own name. Panels follow the selected symbol, so changing the ticker in one place moves the whole screen.

  • Drag and resize; layouts save without being asked
  • Presets for common workflows, editable afterwards
  • Every panel tracks the selected symbol
The workspace with chart, financials, portfolio, news, analyst target and heatmap panels arranged on one screen
13 · Markets and News

The state of the market on one screen.

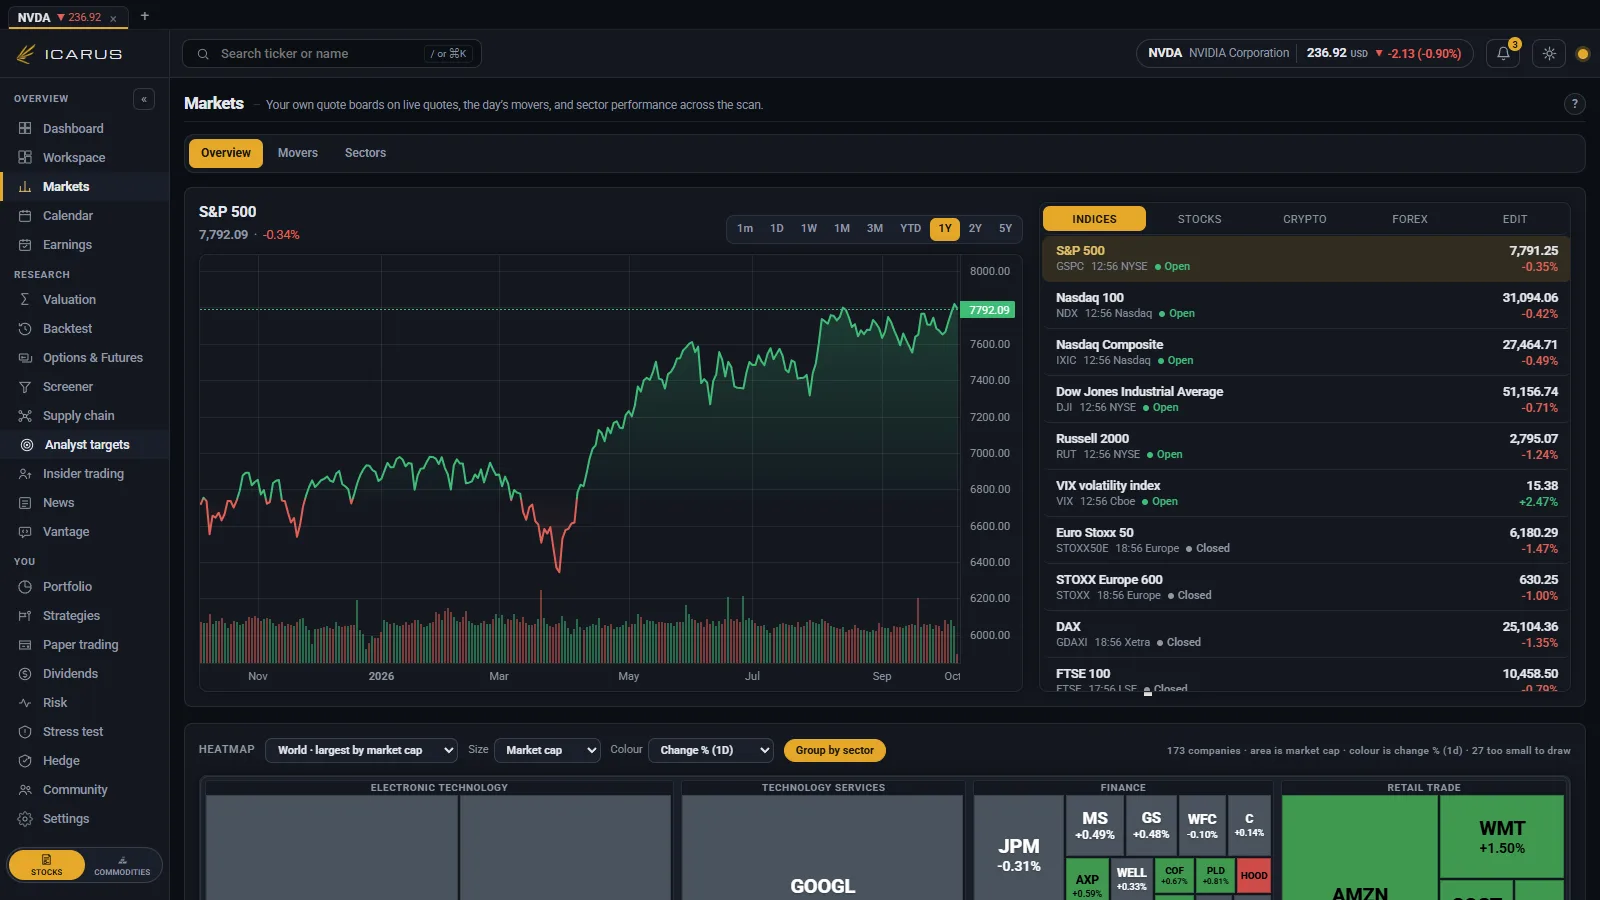
Markets opens on an index chart with the world’s major indices, largest stocks, crypto and currency pairs listed beside it. Below sits a heatmap of the market itself: the largest companies by market capitalisation in United States dollars, grouped by sector and coloured by the day’s move.

The heatmap can cover the whole world or narrow to one index or exchange: the S&P 500, the Dow, the FTSE 100, the DAX, Nasdaq, Oslo Børs or Stockholm. News is filed per symbol, per sector and by theme, with the source on every headline.

  • Tile size is market capitalisation in one currency, so sizes compare
  • World by default; indices and exchanges are one control away
  • Headlines carry their source and open in place
The markets view with an index chart, a list of world indices and a market heatmap grouped by sector
14 · Alerts

Conditions you set, checked while you are elsewhere.

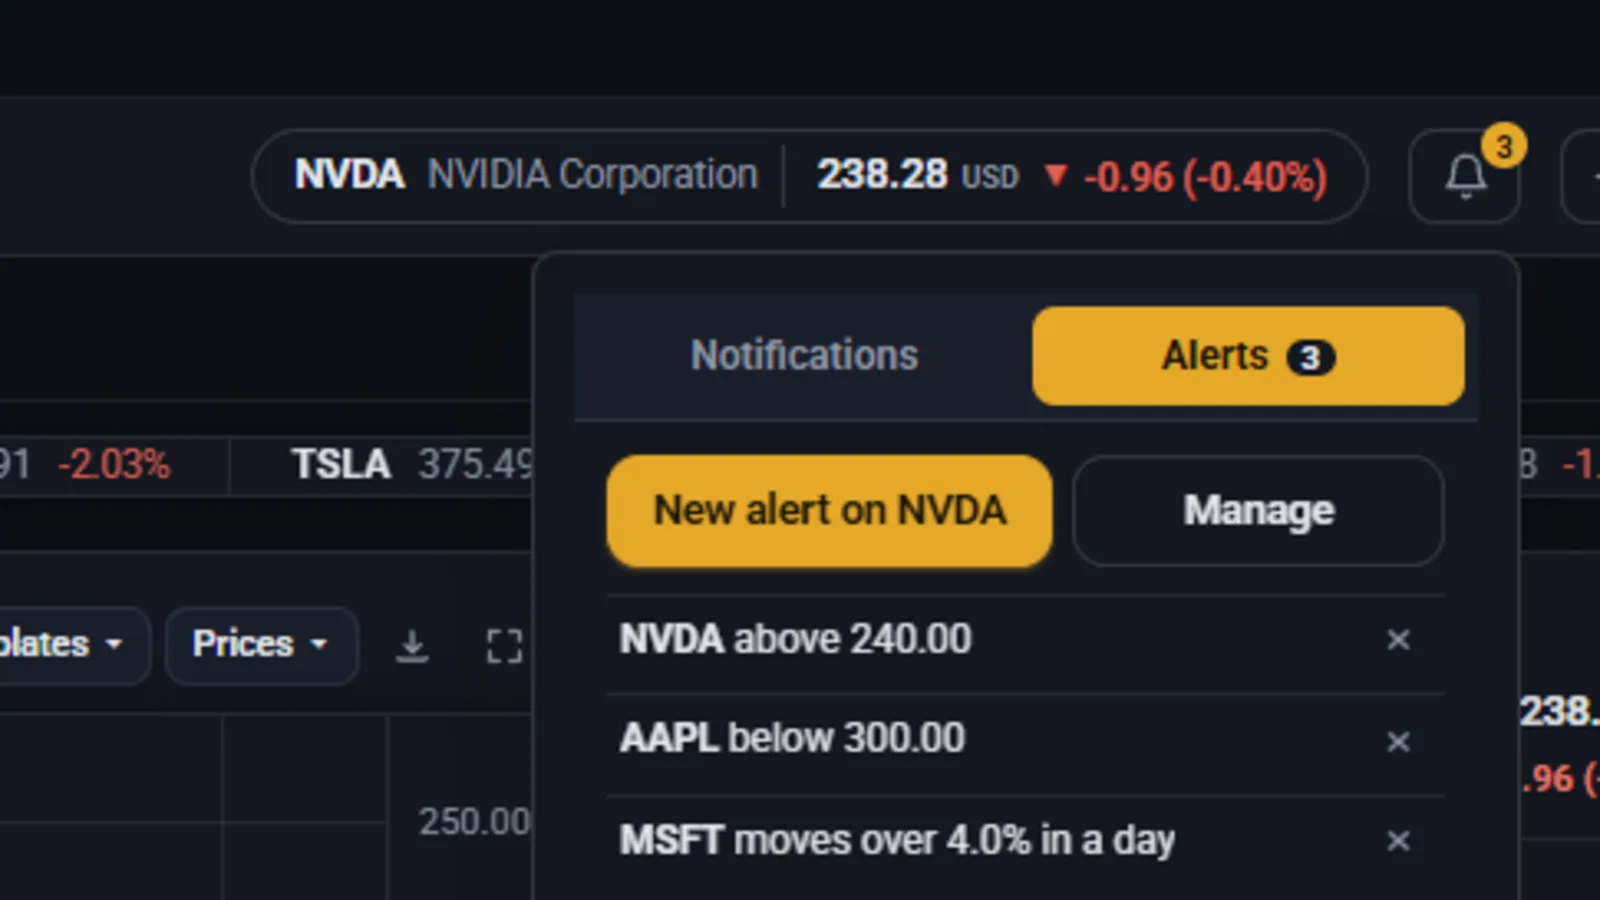
An alert is a condition on a symbol: a price level crossed, a moving average signal, an indicator band or an earnings date. Conditions can be combined, and each alert is listed with its status until it fires or you remove it.

Alerts arrive in the notification panel, and by push once the terminal is installed as an application. They survive a reload, and a triggered alert links back to the panel that raised it so the context is one click away rather than something you have to reconstruct.

  • Price, indicator and event conditions
  • Kept across sessions, not just the open tab
  • Each notification links back to what raised it
The NVDA dashboard with the Alerts tab open in the notifications panel, listing three alerts: NVDA above 240.00, AAPL below 300.00 and MSFT moving more than 4% in a day
15 · Supply chain

Who a company depends on, and where they are.

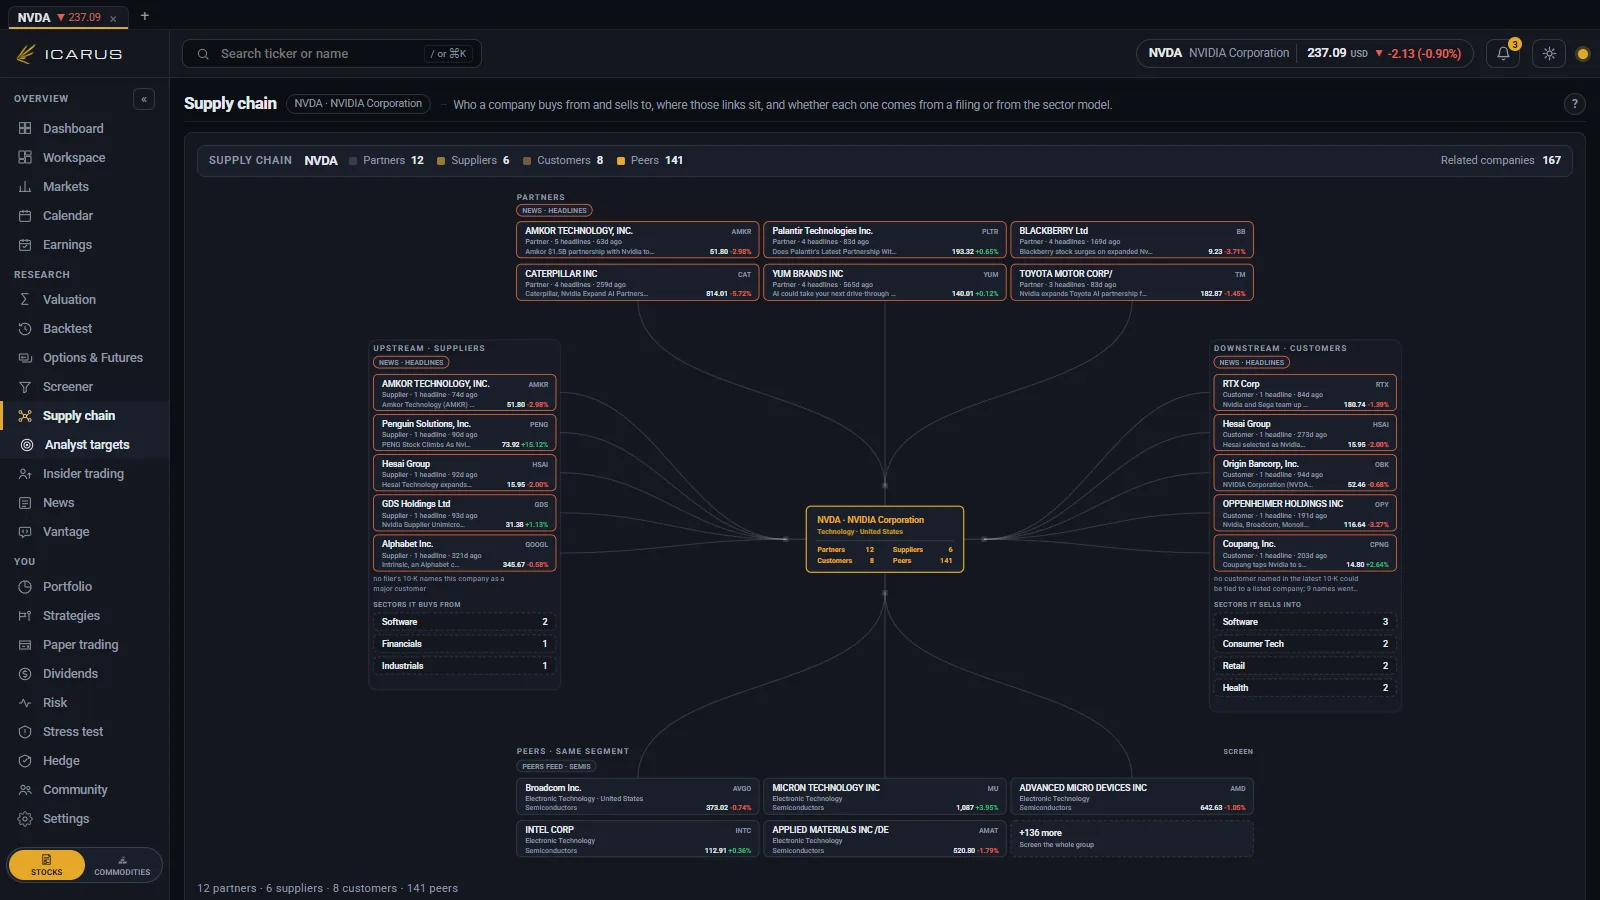
This page draws the chain a company sits in: the suppliers it buys from on one side and the customers it sells to on the other, each labelled with what the link is. Any box opens the screener on the companies in that segment.

Below it, the same chain on a world map. Countries are shaded by the side of the chain they carry, and a country that carries both is marked, because trouble there reaches the company twice. Pointing at a country lists every link inside it.

  • Compiled from public reporting, with the coverage stated rather than implied
  • Every box opens the screener on the names in that segment
  • A chain built from sector adjacency says so instead of inventing countries
The supply chain page: suppliers and customers either side of the company, above a world map with the countries in that chain shaded
16 · Commodities

The same terminal, switched to the physical world.

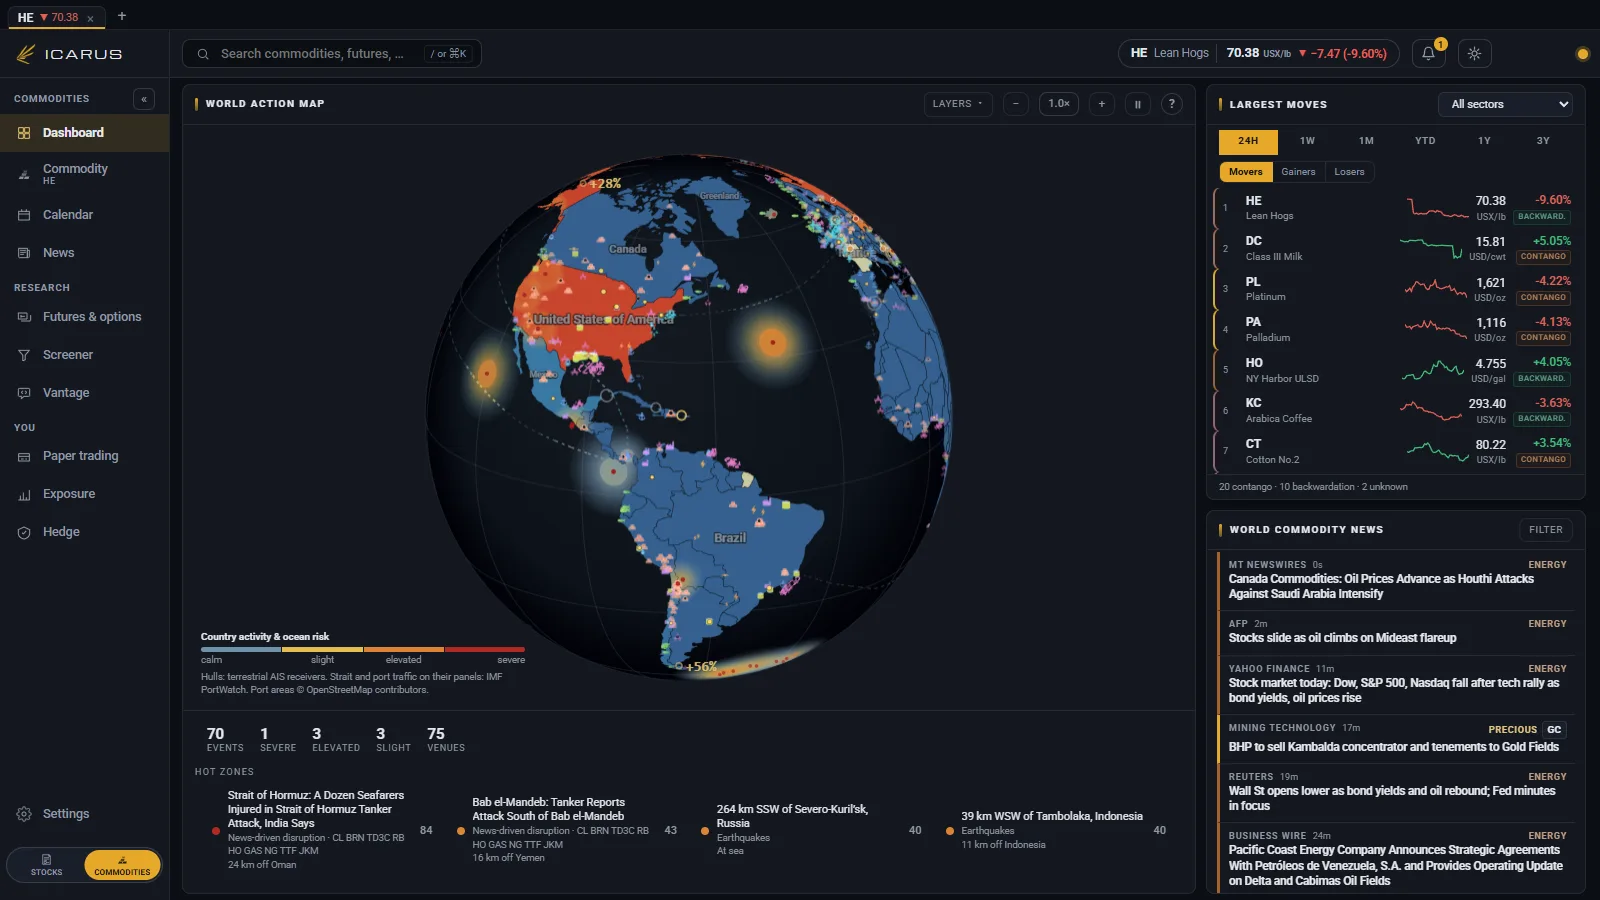
A share is a claim on a business. A commodity has to be dug up, grown, shipped and stored, and its price reflects all four. The switch at the foot of the sidebar turns the terminal to that physical world: a globe shaded by what is happening in each country, the shipping lanes that move the goods, and every contract with the supply and demand behind its price.

From there the pages follow the same shape as the equity side. Each contract has a page of its own, with its price history, the contracts it moves with, the countries that produce it and the news that matters to it. There is a futures and options page, a hedge page that sizes a futures hedge against a physical position, a screener, a calendar of reports and delivery months, a paper trading account, an exposure page for a book of physical positions, and a News page for every commodity headline.

  • Events, alerts and earthquakes resolved to the countries they hit
  • Forward curves, carry, positioning and option pricing on the contract
  • In Pro, in Commodity trader, and in the beta
The commodity terminal: a globe shaded by activity with event and infrastructure markers, the day's largest moves beside it and world commodity news below
17 · Insider trading

What the people running a company do with its shares.

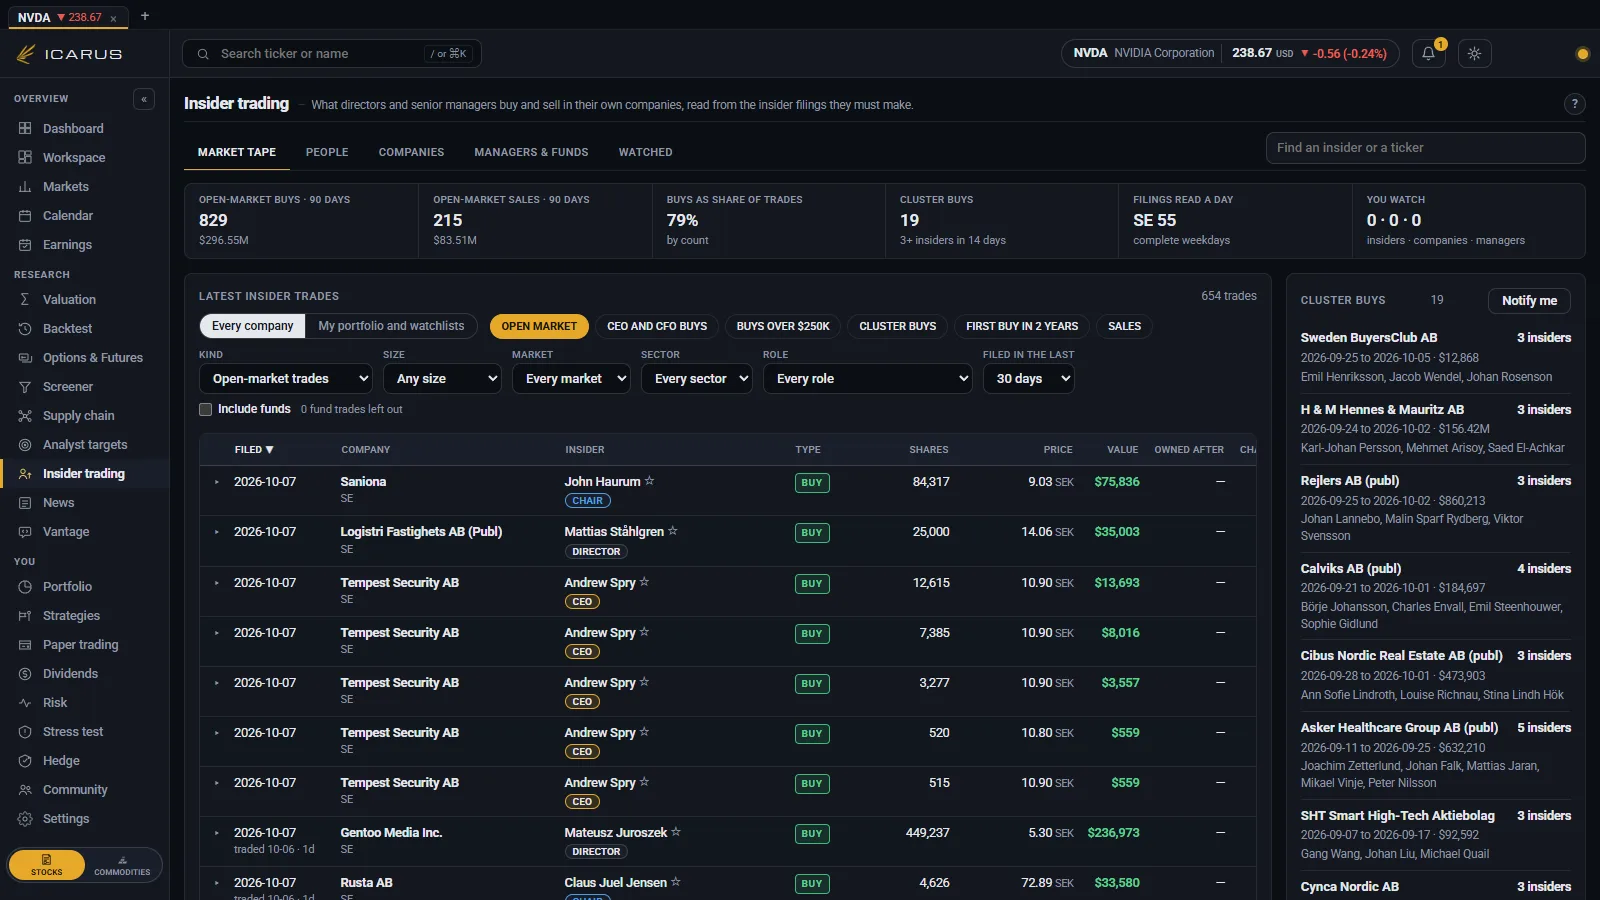
Directors and senior managers have to report when they buy or sell shares in their own company. This page lists those reports for the US and Sweden over the last 90 days, newest first, with purchases and sales on the open market shown before grants and option exercises.

When three or more insiders buy the same company within 14 days, it is flagged as a cluster buy. Opening a company shows each trade marked on its price chart, buys pointing up and sales pointing down, with the net value bought or sold each week underneath.

  • Filters for size, market, sector, role, your watchlist or your portfolio
  • The largest purchases and sales of the last 30 days
  • An alert when insiders buy a company you follow
The insider trading page: the latest insider trades with buys and sales marked, the cluster buys beside them and the largest sales of the month
18 · Vantage

Ask a question, and get the code that answers it.

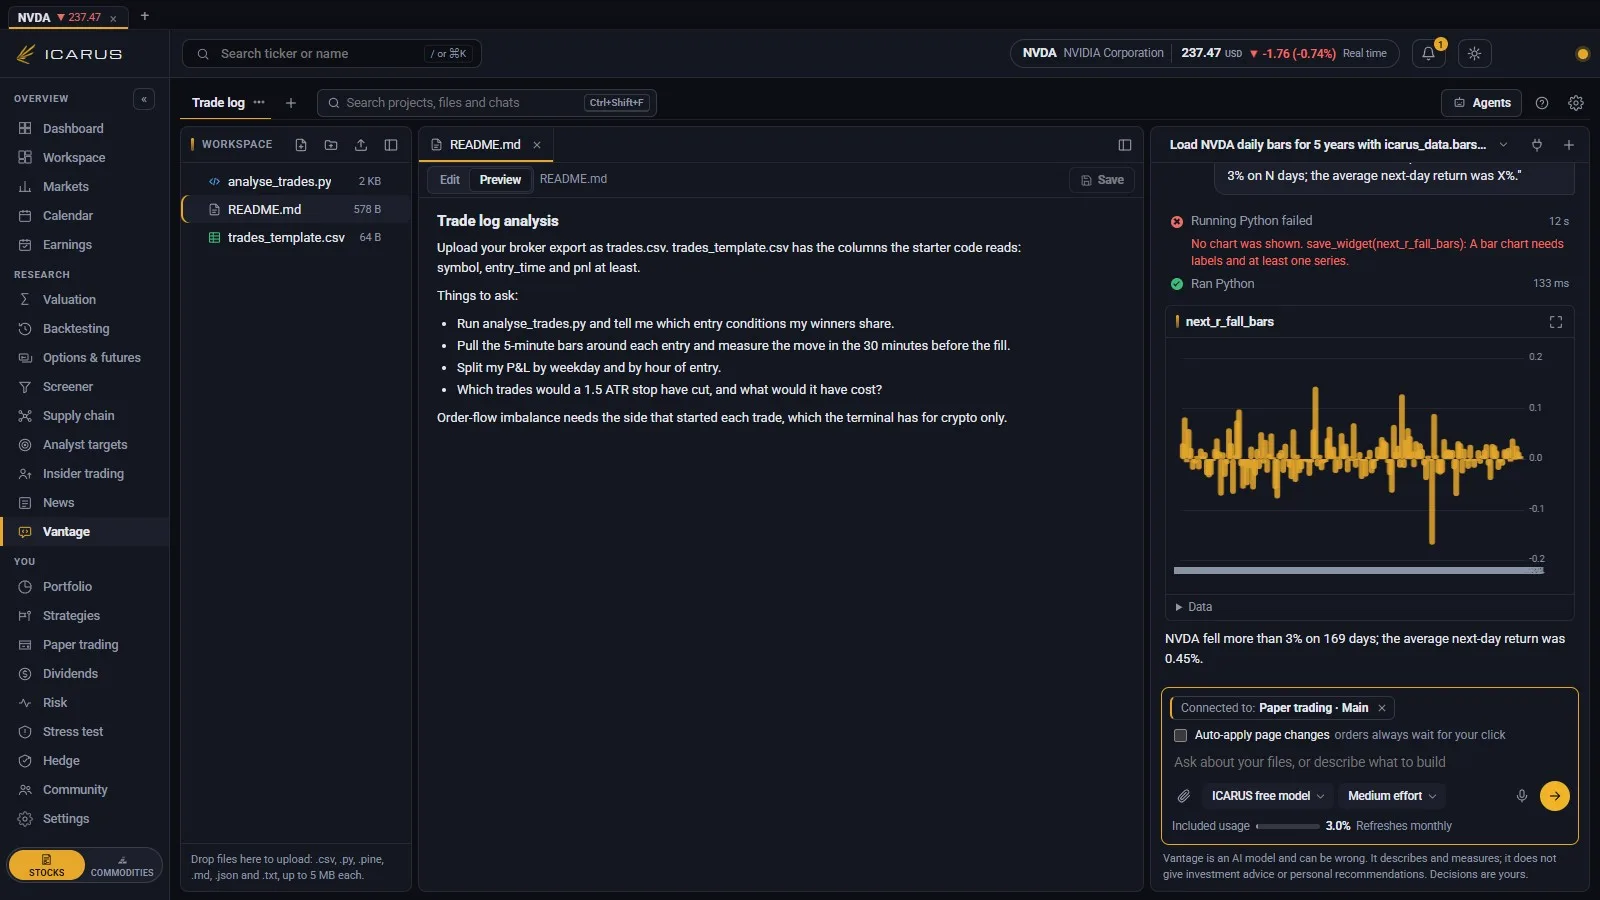
Vantage has three panes: your files, a code editor and a chat. Ask a question in plain words, such as how a stock has moved after its last earnings, and a model writes Python for it, runs that code in your browser on the terminal’s market data, and answers with the chart and the code that drew it.

The model sits in front of the terminal’s own engines. It can run a backtest, a valuation or an option price and show the result, and when a chat is connected to Valuation, Backtest, Strategies, Paper trading or a prop challenge it proposes changes and orders that you apply or leave. It does not forecast prices.

  • The built-in model on Equities analyst and Pro, your own key for a model provider, or a local model
  • Code runs in your browser and reaches data only through the terminal
  • Nothing changes on a page until you apply it
  • Agents: saved tasks that run on demand or on a schedule while Suros is open
Vantage: the project files, the Python the model wrote and the chart it drew, beside the chat that asked for it

Four more parts of the terminal.

19 · All events

Everything that touched your names, in the order it happened.

All events, a tab on the News page, is one stream, newest first, built from what the terminal already reads: headlines, companies' current reports, analyst rating changes, insider filings, the quarterly holdings of funds you watch, results, economic releases, commodity events, large price moves, your own alerts and your paper fills.

Mine keeps it to your watchlist, your portfolio and the people, companies and funds you watch; Whole market shows everything. Each row shows the move since the close before it happened, rows that arrived since your last visit are marked, and a source your plan does not include, or that did not answer, says so instead of going quiet.

20 · Community

Share a model, and import someone else's.

Members publish valuations and strategies as posts, under a username or anonymously. The feed sorts by Hot, New or Top and by tag, posts take comments and stars, and you can follow an author.

Importing a post copies the model or strategy into your own terminal, where you can change it. The figures on a card are the author's and are labelled as theirs. Suros does not check them, and a post is never advice.

21 · Power

Day-ahead power prices, country by country.

The Power page in the commodity terminal has two tabs. World is a map with each country shaded by today's day-ahead price, a ranked list beside it and every country's tables below.

Country opens one market: its prices, its demand and generation by fuel, the weather at its grid areas and stations, its reservoirs or, in the US, its grid regions, and its power stations. A day's actual demand and generation shows only once that day has ended on its market's clock.

22 · Strategy export

Take a strategy to the platform you use.

A strategy you built or imported exports as Pine Script v6, MQL5, NinjaScript 8, a cTrader cBot, Python or a Suros file. What a platform cannot compute is listed in the export dialog and at the top of the file, with how it changes the strategy.

Every code download asks you to confirm the strategy is yours to use and that you will check the code before you run it. Suros does not run the files on those platforms, and it sends no signals or orders anywhere.

Product tour

See the terminal in motion.

The laptop shows the dashboard and the phone the same screen in the phone layout, both recorded in the running app on real market data. The beta opens it on the whole market.

Join the waitlist Sign in

See it for yourself.

The beta runs the full terminal in the browser. Access is by waitlist, and the address you sign up with is emailed when it is let in.

Join the waitlist Sign in
Beta is by invitationJoin the early-access list
Join